Tackling Common Mainframe Challenges
Today, we’re going to talk about the mainframe. Yes, that mainframe which hosts more transactions, daily, than Google; that mainframe which is used by 70% of Fortune 500 companies; that mainframe which is currently seeing a 69% sales rise since last quarter. Over the decades, analysts predicted the mainframe would go away, particularly in current years with the ever-expansive public cloud, but it’s challenging to outclass the performance and reliability of the mainframe, especially when new advancements have been made such that 1 IBM Z system can process 19 billion transactions per day.
Since the mainframe seems here to stay and it’s a critical IT component, we need to make sure it’s appropriately monitored. If you Google “Mainframe Monitoring Tools”, you’ll find a plethora of bespoke mainframe tools. Most of these tools are great at showcasing what’s happening inside the mainframe…but that’s it. Yes, of course we need to know what’s happening in the mainframe, but when leadership asks, “why are we having a performance issue”, silo’d tools don’t provide the necessary context to understand where the problem lays. So, what can provide this critical context across multiple tools and technologies?
The Dynatrace Software Intelligence Platform was built to provide intelligent insights into the performance and availability of your entire application ecosystem. Dynatrace has been an industry leader in the Gartner APM quadrant ever since the quadrant was created and it’s trusted by 72 of the Fortune 100. Maybe more pertinent to this blog, Dynatrace is built with native support for IBM mainframe, in addition to dozens of other commonly-used enterprise technologies. With this native support for mainframe, Dynatrace is able to solve some common mainframe headaches, which we’ll discuss below.
End-to-End Visibility
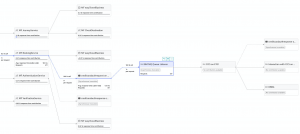
As mentioned earlier, tailored mainframe tools allow us to understand what’s happening in the mainframe, but not necessarily how or why. Dynatrace automatically discovers the distributed applications, services and transactions that interact with your mainframe and provides automatic fault domain isolation (FDI) across your complete application delivery chain.
In the screenshot above, we can see the end-to-end flow from an application server (Tomcat), into a queue (IBM MQ), and then when that message was picked up and processed by the mainframe “CICS on ET01”. With this service-to-service data provided automatically, out-of-the-box, understanding your application’s dependencies and breaking points has never been easier.
Quicker Root Cause Analysis (RCA)
With this end-to-end visibility, RCA time is severely reduced. Do you need to know if it was one user having an issue, or one set of app servers, or an API gateway, or the mainframe? Dynatrace can pinpoint performance issues with automated Problem Cards to give you rapid insight into what’s happening in your environment.
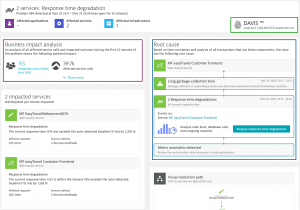
When there are multiple fault points in your applications, Dynatrace doesn’t create alert storms for each auto-baselined metric. Instead, Dynatrace’s DAVIS AI correlates those events, with context, to deliver a single Problem, representing all related impacted entities. An example of a Problem Card is displayed below:
In the screenshot above, there are a couple key takeaways:
- In the maroon square, Dynatrace tells you the Business impact. When multiple problems arise, you can prioritize which are the most important by addressing first the Problem with the largest impact
- In the blue square, Dynatrace provides the underlying root cause(s). Yes, we can also see there were other impacted services, but at the end of the day, long garbage-collection time cause slow response times.
- This is a critical mainframe example. Yes, the mainframe is not the root cause in this case, but that’s great to know! Now, we don’t have to bring in the mainframe team, or even the database team. We can go straight to the frontend app developers and start talking garbage collection strategies.
- Finally, Dynatrace is watching your entire environment with intuitive insights into how your systems interact. Because this problem was so large, there were over a billion dependencies (green square) that were analyzed before providing you a root cause. There is simply no way this could be manually.
Optimize and Reduce Mainframe Workloads
The IBM Mainframe uses a consumption-based licensing model, where the cost is related to the number of transactions executed (MSUs; “million service units”). As more and more applications are built that rely on the mainframe, the number of MIPS required increases. Tools that focus only on understanding what happens in the mainframe can tell you 10,000 queries were made, but not why. Because Dynatrace provides end-to-end visibility from your end user to your hybrid cloud into the mainframe, it can tell you exactly where those queries came from. These insights are critical to identifying potential optimization candidates, and can help you tackle your MIPS death from a thousand paper cuts.
In the screenshot below, you can see that (in green) that 575 messages were read off the IBM MQ, but then that caused 77,577 interactions on the mainframe! Likely, there is room for great optimization here.
Yes, those requests may have executed quickly, but maybe they could been optimized so that only 10 mainframe calls needed to be executed, or even 5, as opposed to ~135. Without Dynatrace, it is an intense exercise for mainframe admins to track down all of the new types of queries that are being sent to them.
In Closing
With Dynatrace, all of your teams can share a single pane of glass to visualize where performance degradations and errors are introduced across the entire application delivery chain. With its native instrumentation of IBM mainframe, Dynatrace provides world-class insights into what’s calling your mainframe, and how that’s executing inside the system.
Now that we’ve discussed the common mainframe headaches of end-to-end visibility, root cause analysis, and workload optimization, it’s time to conclude this high-level blog. Hopefully this blog has given you insight into common use cases where Dynatrace provides immense value to mainframe teams, application developers, and business owners. Soon, we’ll be following up with a more technical Dynatrace walkthrough to show you exactly how to get to this data.
Until then, if you have any questions or comments, feel free to reach out to us at ema@evolvingsol.com. We’d love to chat and learn the successes and challenges you have with monitoring your mainframe environments.


