If SAP is so critical, why are there so many unanswered performance questions? Part 2 – The Solution
The Solution
Last week, we discussed the three common shortcomings of SAP and its supporting portfolio regarding monitoring mission-critical business applications and their key workflows. This week, we will dig into a solution that can assist with each of these three use cases. Without further ado…
Enter AppDynamics for SAP. Now, before any preconceived notions of AppDynamics or APM solutions enter your mind, hear me out. I think it’s worth quickly reviewing the three use cases we are trying to solve to get us grounded.
First, we are looking for a way to capture trace-level details about a transaction without direct manual intervention. Manual capturing of traces is too time-consuming and doesn’t help for catching intermittent problems. Secondly, we want to avoid setting manual thresholds everywhere, because there are just too many metrics, and setting performance and timing thresholds for each T-code becomes unwieldy quickly. Lastly, we are looking for a solution that provides monitoring, performance, and contextual information from non-SAP applications and their interactions, whether incoming or outgoing, to SAP and its various components. Existing SAP-based tooling, like Solution Manager, only focuses on SAP, leaving black boxes all around the landscape. Let’s dig into each of these use cases one by one.
1 – Capturing traces without having to manually intervene
If capturing intermittent problems is a requirement, and no one can never know when a problem will arise, continuous capture is a necessity. We already know, from last week’s blog, that SAP tracing can’t be left on all the time due to overhead concerns, so what’s the solution? The solution is to leverage AppDynamics’ “intelligent snapshot” (link to https://www.appdynamics.com/blog/product/the-intelligent-approach-to-production-monitoring/) capabilities for capturing SAP traces. AppDynamics learns and baselines what is normal (response time, transaction volume, errors, etc.) for each “Business Transaction” – in this case, it could be a T-code, a Function Code, or an Application Component ID.
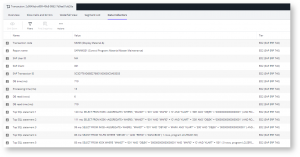
The snapshotting capabilities built into the AppDynamics SAP agent can capture snapshots dynamically without user interaction at times when there are response time anomalies or errors occurring. The agents are evaluating the data 24×7, so you don’t have to. Snapshot details are then sent back to the controller and are available for analysis within the AppDynamics UI. All of the same data you find inside of a standard SAP trace can be found here; the snapshots can contain data like username, pc/computer hostname, and all of the underlying timing details, including things like top ABAP statements, top database queries, outbound HTTP requests, and RFC call details to other systems.
Figure 1 – Example of an SAP snapshot (trace) automatically captured within AppDynamics
2 – Reducing the time and effort to configure alerts
We know that administrators and users complain about spending too much time guessing at which metrics to alert off of and what thresholds to set. Thankfully for us, AppDynamics uses dynamic baselines as a core underpinning of the solution. Every metric that is sent to AppDynamics, whether via an agent, via an extension, or externally via an API call, are all automatically baselined without any configuration. Even better, AppDynamics supports multiple types of baselines, something that the other top APM companies don’t offer within their solutions. This means administrators and users will not have to set static thresholds for every metric they may care about in the future.
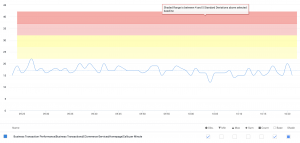
In AppDynamics, baselines like time of day, day of the week, week of the month can be used, and also static timeframes can be leveraged as comparisons. In addition, one of the key functionalities that AppDynamics offers as part of its alerting and visualization concepts is the ability to use standard deviation instead of just percentage change. This really helps to decrease the number of false-positive alerts, as you can specifically identify how many standard deviations off the baseline must be exceeded before changing the health rule into a “warning” or “critical” state. These same concepts of standard deviation can be used to color-code charts and graphs to be able to better understand typical behaviors and outliers, shown in the image below. When there are thousands of metrics being captured for an SAP landscape, no one should have to spend time identifying and configuring thresholds for alerting. This automatic dynamic baselining capability is a true game-changer.
Figure 2: A chart visualizing the captured metric, it’s baseline and the standard deviation “bands”
Figure 3: Optional configuration of a health rule using various baselines and standard deviation
3 – Observing comprehensive system performance inside, outside, and through SAP
To truly understand the health and performance of a holistic environment, the monitoring solution needs to have the capability to tie external applications and services directly to the SAP landscape in a true end-to-end approach. This means the solution not only needs deep monitoring capabilities in SAP, but also outside of SAP, like in Java, .NET, and other common programming language platforms. The solution should provide both overall monitoring and health perspective and the ability to inspect individual transactions, whether a t-code, OData call, HTTP, RFC call, outbound request, or incoming request. All of this means taking an SAP-only approach, like Solution Manager, won’t work.
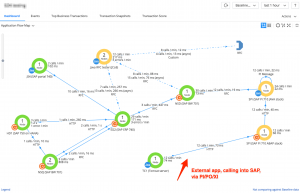
Since AppDynamics has been supporting enterprise applications and frameworks for 10+ years and also supports SAP, this is a no brainer. By leveraging the AppDynamics SAP agent along with agents for the other external applications (i.e. Java), AppDynamics can seamlessly tie all of that data together inside of its Web UI. This gives a complete picture of overall health and performance, outside, inside, and through SAP. See below for a few examples of this exact use case.
Figure 4: An application flow map showing transaction flows into and out of SAP from external apps and services along with timing and volume details.
Conclusion
As IT organizations and business owners continue to struggle at improving SAP availability and performance of key business processes and workflow, it becomes apparent that there are a few shortcomings of the SAP platform and associated products. These shortcomings impact IT’s ability to identify if a problem exists or not (problem identification), where the problem lies (fault domain isolation, a.k.a. FDI) and what the specific problem is within the identified component (root cause analysis, a.k.a. RCA).
By utilizing AppDynamics for SAP, all three of the identified shortcomings in this two-part blog are addressed.
AppDynamics provides:
- Dynamic baselines to proactively identify problems
- Mapping and monitoring of external systems and services into the SAP landscape, providing an end-to-end perspective and decreasing the time spent on fault domain isolation
- Automated tracing to provide insightful root cause analysis for hard-to-capture intermittent problems, without manual effort
Like the ideas and thoughts that we’ve discussed in this blog or any other Evolving Solutions Enterprise Monitoring & Analytics (EMA) content and would like to talk with us more? Our team has helped many of the Fortune 500 companies better monitor their SAP environments and associated applications. Please feel free to reach out to us at ema@evolvingsol.com for a no-cost discussion about your current or future needs.


