Fully Monitoring Kubernetes with Dynatrace
Are you ready to walk through the process of fully monitoring your Kubernetes, or OpenShift, Cluster(s) with Dynatrace? This article will give you the guidance you need for complete Kubernetes visibility. For both of those platforms, the steps are nearly identical; we will simply reference Kubernetes for the rest of this article.
In the new age of containerization, application architecture is more complicated than ever. Instead of single monolithic servers that run one huge service, an application can span dozens, if not hundreds, of individual microservices. The flexibility microservices grant comes with the cost of complicated dependencies. As this containerization pattern continues to evolve, so must your monitoring solution. How do you know if all of your microservices are performing as expected and they’re communicating correctly?
The Dynatrace “Software Intelligence Platform” is built with containers in mind, as first-class citizens. Dynatrace natively supports automatic code-level injection into containers, whether they’re run in Kubernetes, OpenShift, or Docker Swarm. However, if you Google “Dynatrace Kubernetes,” there are too many results to choose from. Dynatrace has excellent documentation on the steps to hook up Kubernetes. However, still, the question has been asked by multiple customers, “What steps do I need to follow to monitor my Kubernetes environment with Dynatrace?” Stop searching! This article addresses all you need to know about Kubernetes monitoring with Dynatrace. It will not rewrite the Dynatrace documentation but instead reference their verbose instructions.
Two Paths for Monitoring Kubernetes (K8s) with Dynatrace
The trickiest piece to remember when monitoring K8s with Dynatrace is two different, complementary approaches must both be taken in tandem for 100% coverage and visibility.
Do you have Host Units set aside for code-level visibility into Kubernetes?
- If the answer is yes, congratulations! After performing both of the following tasks (“Monitoring via the Kube API” and “Monitoring via the OneAgent”), you have full insight into your K8s Cluster, all of the way down to code execution inside of your containers.
- If the answer is no, you can still connect to K8s, via the K8s API, and pull Cluster, Node, and Pod-level metrics and events. You only need to follow the “Monitoring via the Kube API” steps below.
Monitoring via the Kube API (Free)
Dynatrace can monitor your Kubernetes environment, for free, by leveraging the Kubernetes API. Monitoring will give you insights into Cluster, Deployment, and Pod health, containing metrics for all three and events happening in your environment.
Requirements
You will need a Dynatrace Environment ActiveGate (v1.189+) which can communicate with your K8s Cluster.
Goal
After setting up this integration with each of your K8s clusters, you will see each Cluster listed on the `Kubernetes Overview` page.
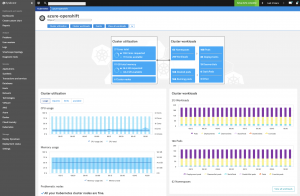
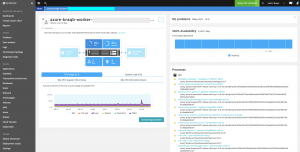
Clicking on any of your clusters, you’ll see further information about the cluster:
Node Overview:
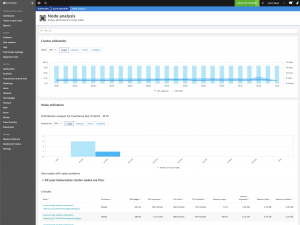
Node Analysis:
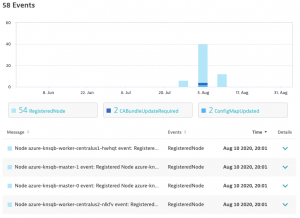
Also, after enabling cluster events, you see them on the overview page.
Implementation
To set up this monitoring, follow the Dynatrace documentation here.
Here are the high-level next steps:
- Create a Dynatrace Namespace in K8s (step 1). This is where the Dynatrace Service Account is created, which Dt leverages when calling the Kube API
- Create the Dynatrace Service Account (step 2)
- Get the URL, and Bearer Token Dt needs to communicate to the K8s Cluster (steps 3-4)
- Configure Dynatrace using the values from our previous step
These steps get you your Cluster and Node-level metrics. To gain Pod visibility and events, you need to “Set up Kubernetes Workloads” (in the same documentation as above). This step is a little trickier because there are a couple of buttons to toggle, although the newest version of Dynatrace makes this more straightforward (198, at the time of publication):
- Ensure “Show workloads and cloud applications” is enabled, so Dynatrace uses its new splitting mechanism in understanding your K8s Deployments
- Ensure “Monitor events” is enabled
- Make sure to follow thein “Workload/application boundaries have to be enabled in the process group detection page.”
- When you enable the “enable cloud application and workload detection” setting, the other radio button disappears (is turned “On” under the hood)
Monitoring via the OneAgent (Host Units cost)
To enable deep code-level analysis, the Dynatrace OneAgent needs to be deployed to the Kubernetes cluster. This is not free and will require Dynatrace Host Units.
Requirements
For each new version of Kubernetes, there is a newer OneAgent which is required. Ensure you have the minimum OA release for your Kubernetes version from this documentation.
Goal
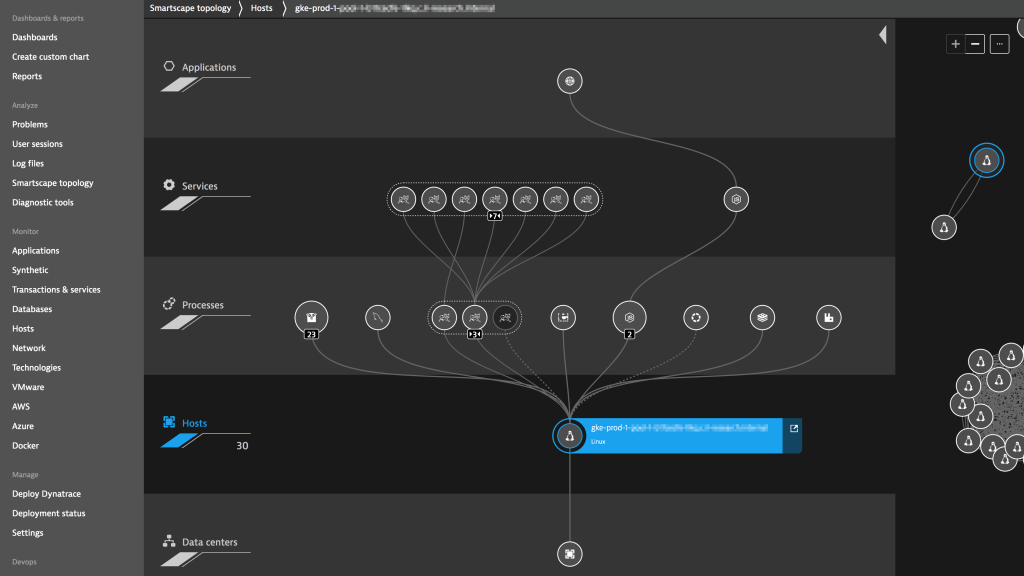
After deploying the OneAgent Operator, you will gain code-level visibility into your Kubernetes workloads and you will gain infrastructure health of the underlying K8s worker nodes. Look at the “Hosts” page to view the underlying Kubernetes nodes and their health, and look at the “Transactions and services” page to see your detected Kubernetes Services.
Implementation
There are three ways in which you can deploy Dynatrace to Kubernetes – via a DaemonSet, an Operator, or a Helm Chart. Dynatrace currently recommends using the Operator, which is a native Kubernetes construct. Documentation discussion the overview of implementing the operator can be found here.
At a high level, you:
- Create a Dynatrace Namespace and all necessary ServiceAccounts, Security Policies, Cluster Role, etc. (step 1)
- Create a K8s secret which stores the Dynatrace credentials (step 2)
- Download, modify and publish the Operator to the Namespace (steps 3-5)
Getting started with Dynatrace
If you care about Kubernetes but don’t have Dynatrace, you can start your free trial here. Need more? Dynatrace’s University offers hundreds of bite-size videos covering all things Dynatrace.
